See how liveable the surroundings of your complexes are, and choose where to intervene.
Housing associations work on affordability, availability, liveability, sustainability and customer satisfaction. Clappform brings fragmented information together into insights for maintenance, investments and service delivery.


Where does your challenge lie?
Housing associations work with ever more data on property, maintenance, liveability and residents. The question is where that data comes together and what it says per complex and per neighbourhood.
Complex Scan
The Complex Scan shows on area maps which complexes you manage in which neighbourhood or district. You also see how liveability is experienced there, based on the Leefbaarometer score.
The scan also collects and analyses reports, incidents, nuisance and maintenance requests. Everything is in one dashboard. That gives you three advantages:
Trends and patterns are quickly visible
Recurring problems are easy to spot
You steer towards improvement
This helps you make decisions and set priorities faster and more effectively.
Integrated Neighbourhood Scan
The Integrated Neighbourhood Scan brings together data from different sources and translates it into actionable insights at district, neighbourhood and address level. The scan does six things:
01
Map: you see the demographic, social, economic and physical characteristics of a district or neighbourhood.
02
Identify: you see trends, opportunities and bottlenecks by comparing districts with each other.
03
Explore: you combine indicators and see how themes are connected, such as liveability, safety, care and participation.
04
Substantiate: you substantiate choices about maintenance and investments with objective data and clear visualisations.
05
Target: you determine where interventions and resources have the most impact.
06
Monitor: you follow developments over time and evaluate your approach.
With the dashboard and the Gebiedskompas, you get an integrated and comparable view of your districts. This lets housing associations steer purposefully on their social and spatial challenges.
Which scan fits your question?
Do you want to see the surroundings of a complex?
Complex Scan
Area maps and a dashboard with four components:
Reports and incidents: overview of complaints, faults, nuisance and repair requests within a complex
Analysis and trends: insight into the frequency, recurrence and development of problems
Dashboard: central place where all data comes together
Gebiedskompas: insight into the living environment and neighbourhood context, such as socio-demographic characteristics and environmental factors that affect the complex
View the Complex Scan
Do you want to compare your districts with each other?
Integrated Neighbourhood Scan
One view of your districts, at district, neighbourhood and address level. You use the six steps above: from mapping to monitoring.
View the Integrated Neighbourhood Scan
Municipality of Veldhoven
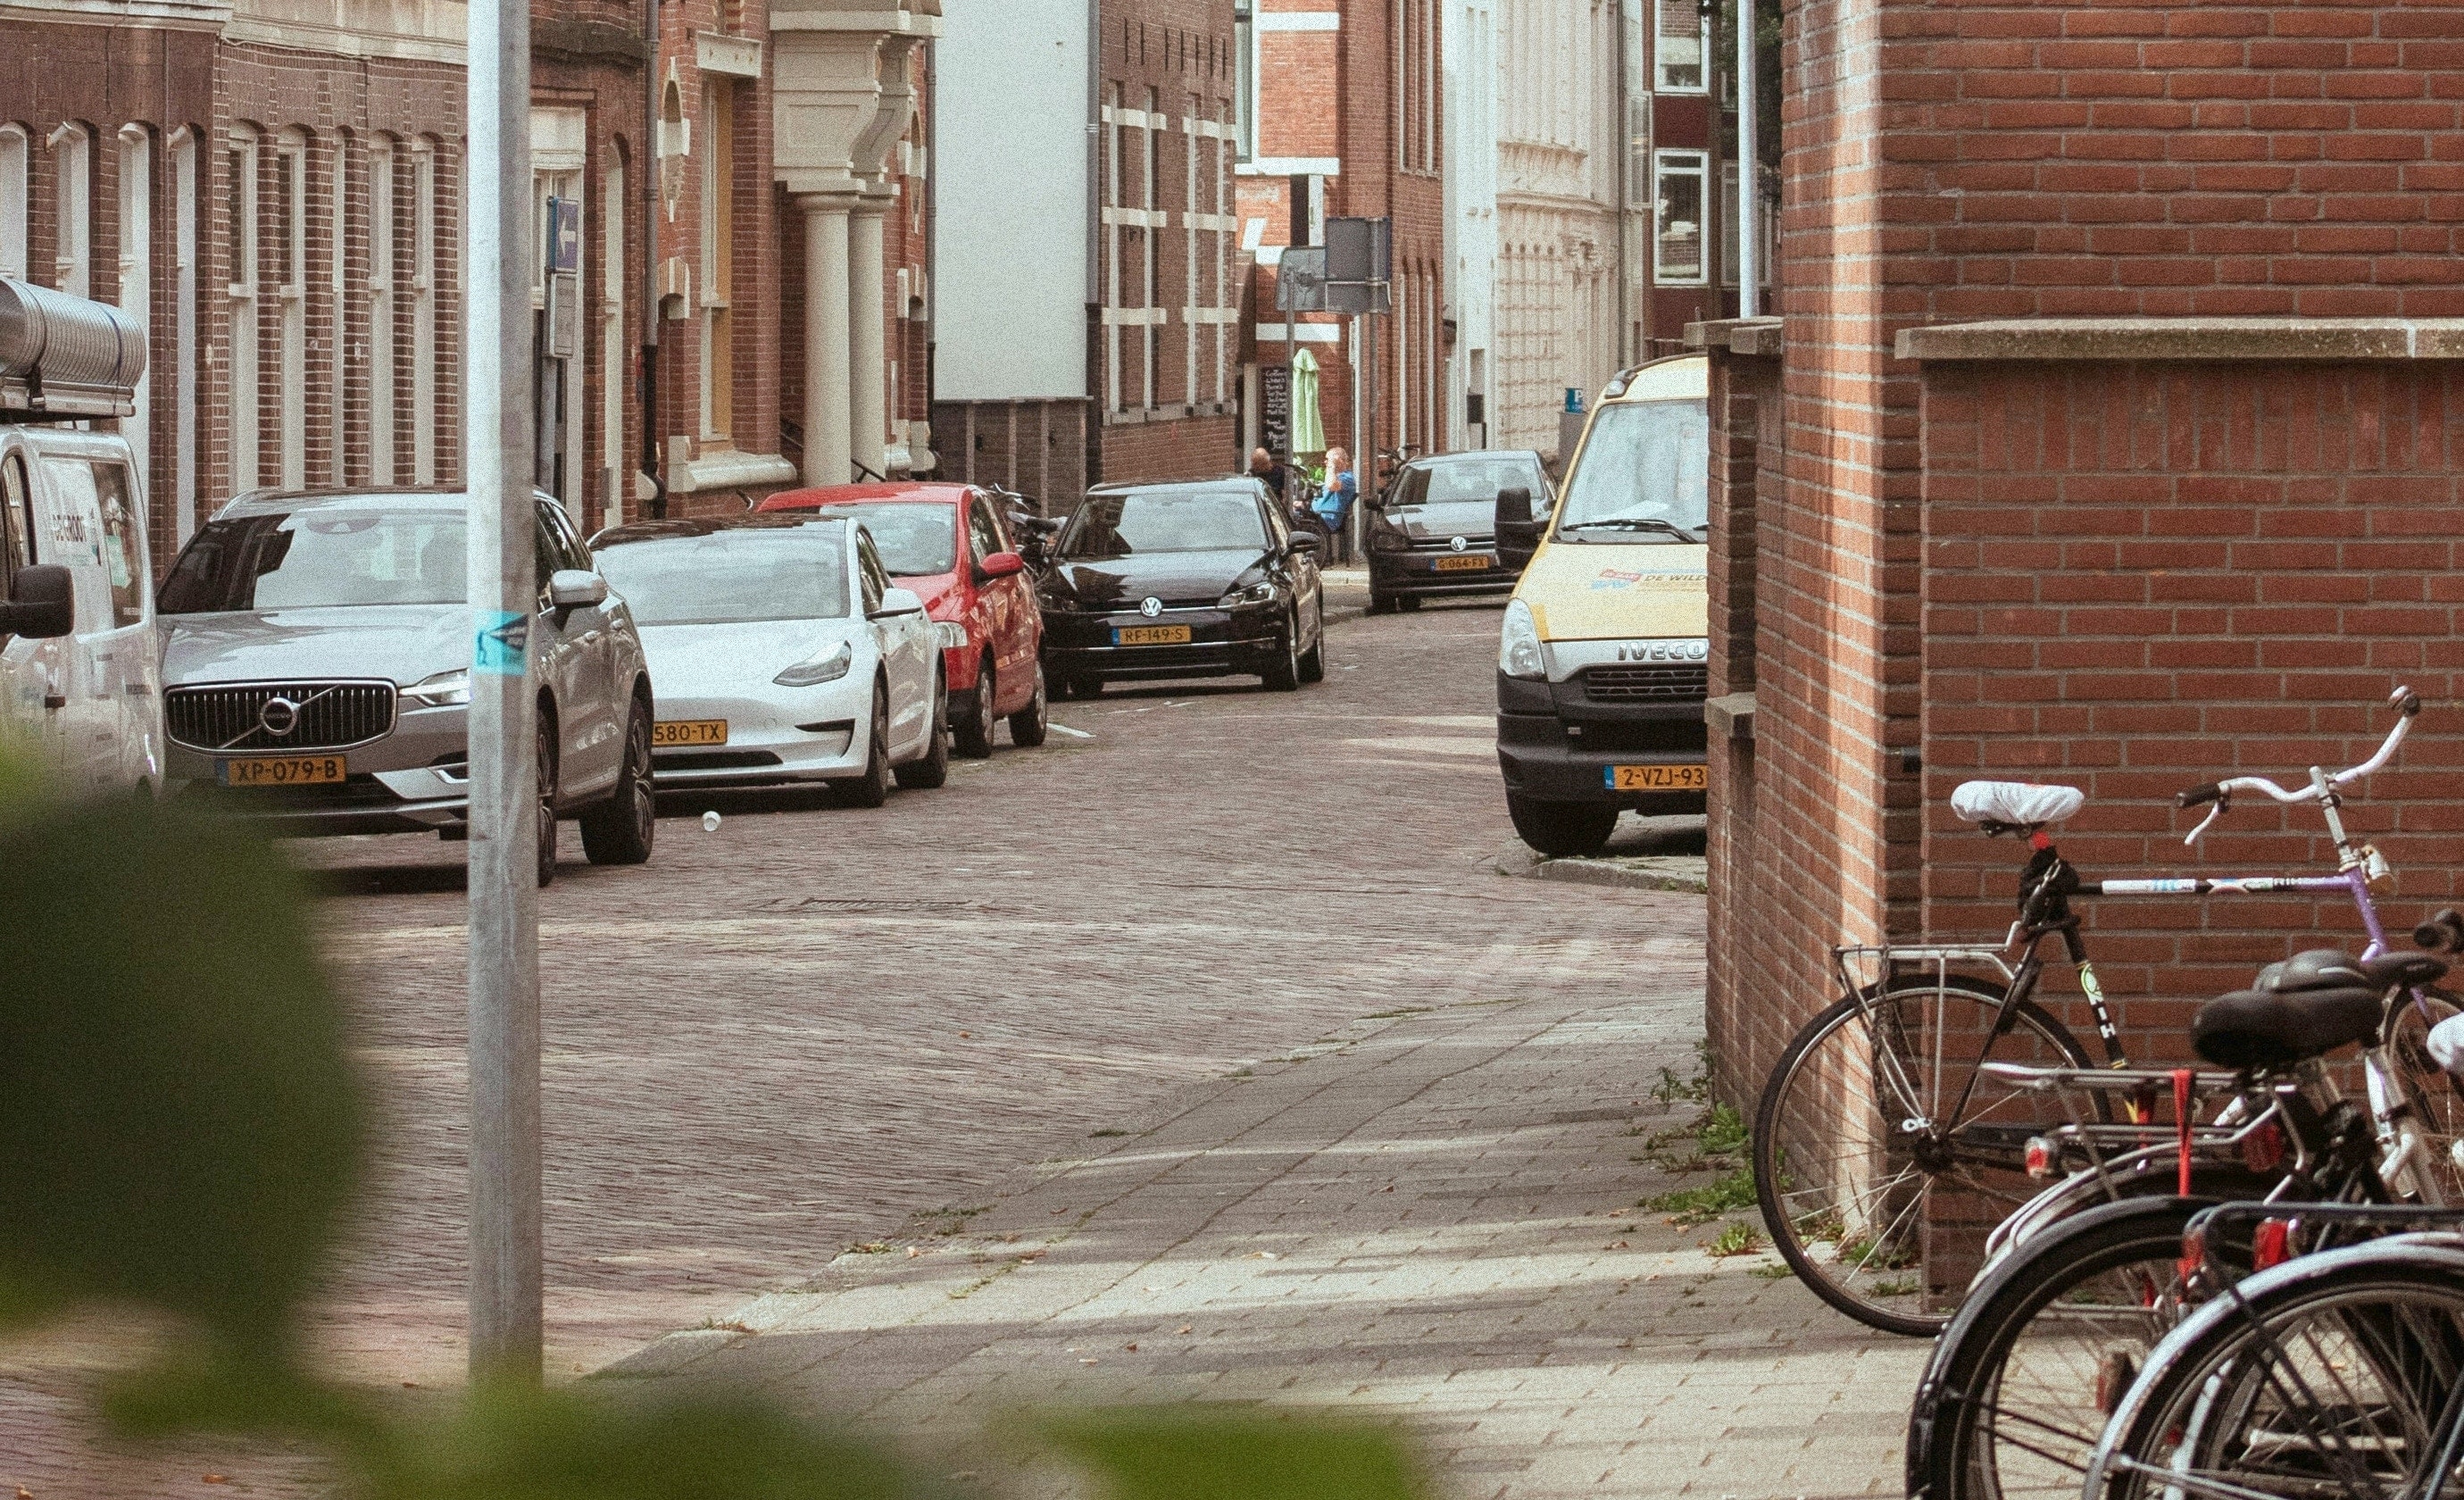
Together with the municipality, Clappform is carrying out a neighbourhood scan in Cobbeek and D’Ekker to improve the living environment for older residents. Data and residents' experiences provide insight into social cohesion, mobility, meeting places and physical quality. Useful for housing associations: the combination of data and residents’ experiences that together describe a district.
Experience of other organisations
Other housing associations already work with the platform. Would you like to talk to one of them? Contact us and we will arrange a meeting.
What you can build on
Common Ground
The platform follows the Common Ground principles.
AVG
The platform supports GDPR requirements with access permissions and logging of who views or changes data.
Certification
Clappform is certified for ISO 27001 and ISO 9001.
Hosting
Clappform runs on Azure or Scaleway. You choose where your data is stored: within the EU or in the Netherlands.
Frequently asked questions
1
What is the difference between the Complex Scan and the Integrated Neighbourhood Scan?
The Complex Scan analyses the surroundings of your complex at district, neighbourhood and complex level. The Integrated Neighbourhood Scan gives one view of your neighbourhoods for a targeted neighbourhood approach.
2
What do I use the insights for?
For maintenance, investments and services.
3
Which data from our housing association goes into the Complex Scan?
The Complex Scan combines public data with data from your housing association in one overview.
4
Is a housing association already using this?
The Municipality of Veldhoven already uses the Integrated Neighbourhood Scan. For housing associations, we are happy to schedule a demo of the Complex Scan.
Want to explore your options?
Tell us what you are working on, for example which complexes or districts you want to look at.